figpack: self-contained interactive figures
Sharing interactive scientific visualizations is hard. I don’t want my colleagues to have to install specialized software. I want to email them a link they can click on to see the full interactive visualization and explore my (potentially large) dataset and results. I want figures to be archivable for the long term, on Zenodo or elsewhere. And I want them to be local first, with no upload required to view. I created figpack to solve these problems by packaging each figure as a self-contained HTML bundle.
Here is how it works. You import figpack in your Python project, pass numpy data (long timeseries, images, domain-specific structures) to a figpack view object, and call view.show(). That creates a completely self-contained bundle in a temporary directory, data and rendering code side by side, and spins up a local web server so it opens in your browser. The directory is the figure; there is nothing else to keep track of.
To share with a colleague, set upload=True. The bundle goes to the cloud and you get back a URL to send along, and your friend sees exactly what you see, with no login and nothing to install. Uploaded figures expire after 24 hours by default, and you pin the ones worth keeping.
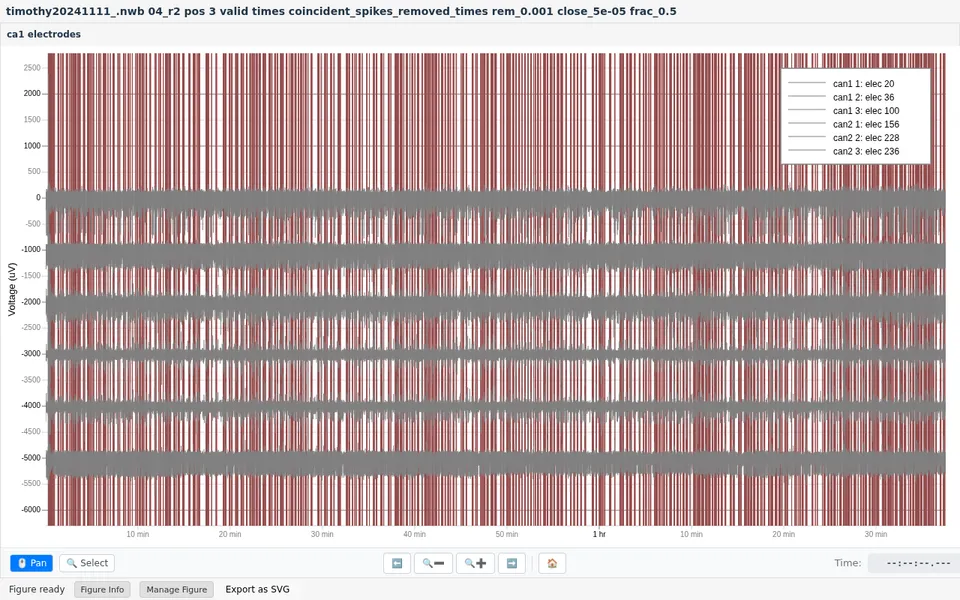
Data inside a bundle are stored in Zarr, so the browser fetches only the chunks the current view needs and figures can hold real datasets. For timeseries, figpack also precomputes a pyramid of min/max summaries, each level four times coarser than the last, down to a few thousand points for the entire recording. Zoomed out you see an envelope that misses no extremum; zoomed in, the viewer switches to the raw samples. This figure is a 1.6-hour recording from six CA1 electrodes at 30 kHz, 175 million samples per channel and 6.5 GB in the bundle, and it pans and zooms as smoothly as a small plot (data courtesy of the Gillespie Lab).
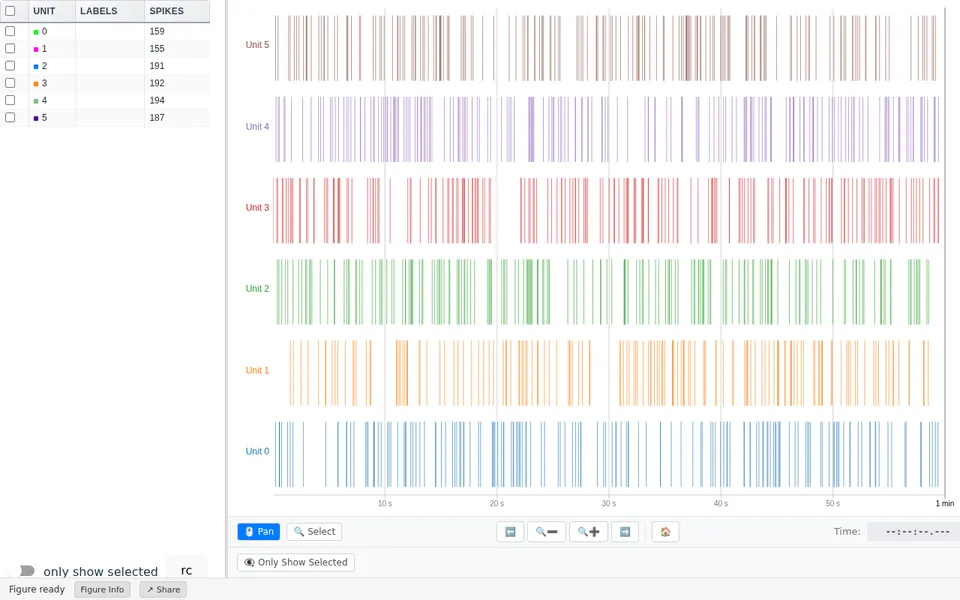
There are many view types, extensible with your own JavaScript/React, and they compose into layouts (boxes, tabs, splitters) that share state, so the current time and the selected units stay synchronized across panels. The spike sorting views from sortingview are ported over: raster plots, autocorrelograms, average waveforms, units tables. Because a figure is a folder of files with no service behind it, you can deposit it on Zenodo, cite it, and expect it to render as long as browsers still run HTML.
Source: flatironinstitute/figpack · documentation